Psychology dissertation Bland-Altman analysis evaluates whether two quantitative measurement methods agree closely enough for a defined purpose. It reveals systematic bias, the spread of paired differences, and whether disagreement changes across the measurement range.
The method is useful when a psychology project compares a new scoring procedure with an established procedure, two devices, two raters using a continuous scale, or two administrations intended to produce interchangeable values. A defensible analysis requires paired observations, prespecified acceptable differences, a suitable data structure, confidence intervals, and conclusions that do not confuse correlation with agreement.
Table of Contents
What is psychology dissertation Bland-Altman analysis?
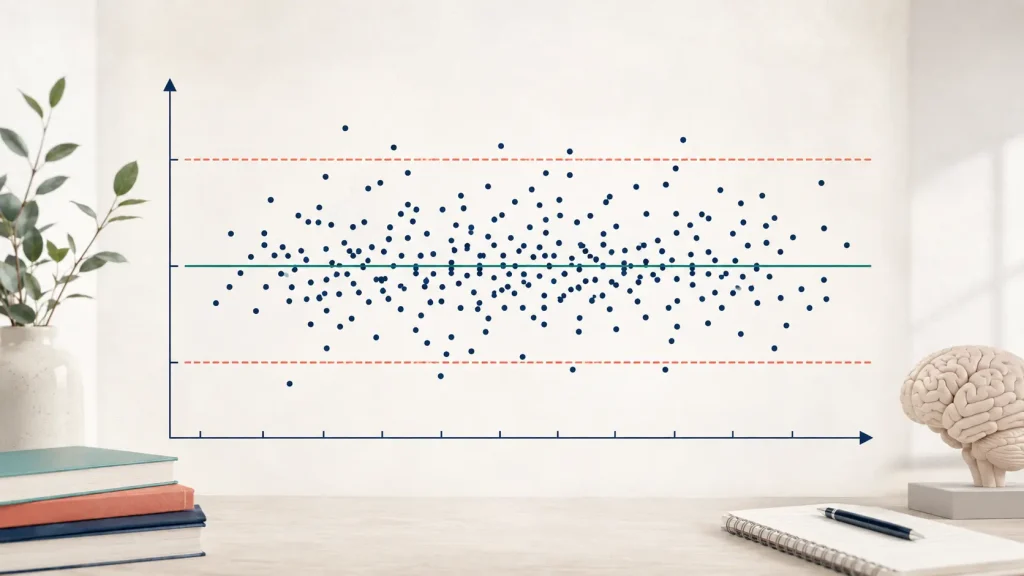
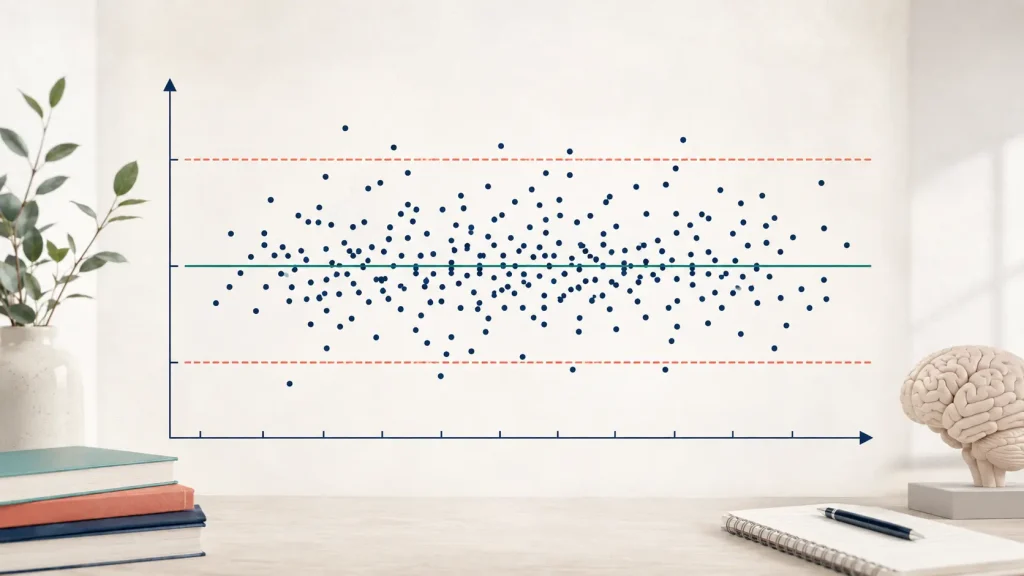
Bland-Altman analysis studies the differences between two measurements made on the same participant or object. For each pair, the conventional plot places the average of the two measurements on the horizontal axis and their difference on the vertical axis. A horizontal line shows the mean difference, often called the average bias, and two further lines show the estimated limits of agreement.
The original method was developed for comparing continuous measurement procedures. The openly reproduced Bland and Altman method-comparison paper explains why correlation coefficients are misleading for deciding whether one method can replace another. Two methods can correlate almost perfectly while one consistently gives values ten points higher.
The analysis quantifies disagreement. It does not automatically decide whether the disagreement is acceptable. That judgement requires limits chosen from psychological, measurement, educational, occupational, or practical consequences before the results are inspected.
Distinguish agreement from association
Correlation measures the strength of a relationship. If participants with high scores on method A also tend to have high scores on method B, the correlation can be large even when the numerical values differ substantially. Multiplying every method B score by two would preserve a perfect linear association while destroying agreement on the original scale.
A paired t test is also insufficient. It assesses whether the mean difference is distinguishable from zero, not whether individual differences are acceptably narrow. A near-zero mean can hide large positive and negative differences that cancel. Conversely, a small precisely estimated bias can be statistically significant but practically unimportant.
An intraclass correlation coefficient can describe relative reliability or absolute agreement under a specified model, but it is influenced by between-person variability. Bland-Altman limits remain in the measurement units and make individual-level discrepancies visible. Use the site’s psychology dissertation reliability-analysis guide when the main question concerns consistency rather than method interchangeability.
| Method | Main question | Why it is not a substitute |
|---|---|---|
| Pearson correlation | Do values vary together linearly? | High association can coexist with large bias |
| Paired t test | Is the mean difference nonzero? | Does not quantify the spread of individual differences |
| Intraclass correlation | How reliably are people differentiated? | Depends partly on sample heterogeneity and model choice |
| Bland-Altman limits | How large are paired differences likely to be? | Still requires an external acceptability criterion |
Define the estimand and acceptable disagreement
Before collecting or viewing the focal data, define what is being compared. Name the two methods, the direction of subtraction, the outcome scale, the population, the setting, and the intended use. “New minus reference” and “reference minus new” produce opposite signs, so the direction must remain consistent throughout the analysis and report.
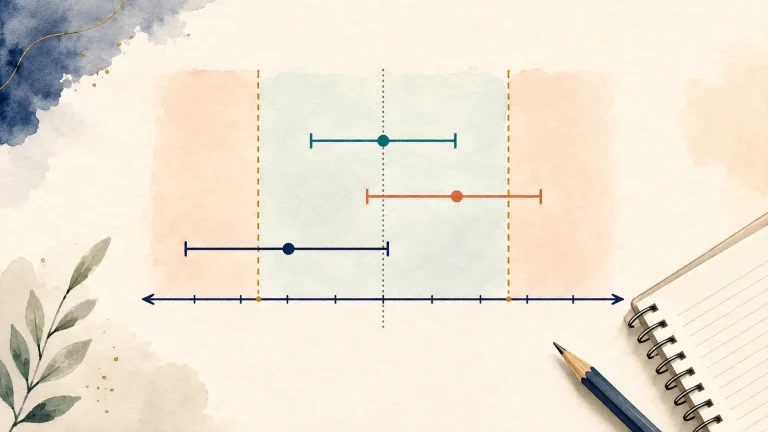
Then define the largest differences that would still be acceptable. These limits of acceptable difference are not the same as the estimated limits of agreement. Acceptability bounds are substantive criteria. Estimated limits are sample-based descriptions of the distribution of differences.
For example, a dissertation may compare a five-minute digital reaction-time task with a laboratory task. Before analysis, the student and supervisor might decide that differences larger than 40 milliseconds in either direction would make individual scores unsuitable for substitution. That threshold needs a defensible basis such as decision consequences, prior validation work, task precision, or stakeholder requirements.
The peer-reviewed open tutorial on Bland-Altman analysis stresses that the method estimates agreement but does not itself determine whether the limits are acceptable. Post hoc thresholds shaped around the observed limits make the evaluation circular.
Calculate bias and limits of agreement
For each participant, calculate the difference between method A and method B. The mean of these differences estimates average bias. Under the conventional model, the lower and upper 95% limits of agreement are the mean difference minus and plus 1.96 times the standard deviation of the differences.
These limits estimate the range expected to contain approximately 95% of individual differences when the assumptions are suitable. They are not a confidence interval for the mean bias. They are also not fixed boundaries known without error.
Report uncertainty around every limit
The mean bias and each limit are estimated from a sample. Report confidence intervals for all three. A small sample can produce apparently narrow or wide limits by chance, and the confidence intervals show how precisely population agreement has been estimated.
Sample-size planning should target useful precision for the limits or a clear decision against prespecified acceptability bounds. Do not copy a sample size designed for a correlation and assume it provides adequate agreement precision. The psychology dissertation power-analysis guide explains how to document assumptions and sensitivity analyses.
| Quantity | Meaning | Responsible interpretation |
|---|---|---|
| Mean difference | Average systematic offset | Its sign depends on subtraction order |
| Standard deviation of differences | Spread of person-level disagreement | Assumes one common spread in the conventional model |
| Lower limit of agreement | Lower expected boundary for most differences | Report its confidence interval |
| Upper limit of agreement | Upper expected boundary for most differences | Compare with the prespecified acceptable bound |
| Acceptability limits | Maximum tolerable disagreement for the intended use | Define independently of the observed results |
Build and inspect the Bland-Altman plot
Plot each paired difference against the pair’s mean. Add horizontal lines for zero, mean bias, and both limits of agreement. Confidence bands around the bias and limits are valuable when software supports them. Label axes with the outcome and units, state the subtraction direction, and identify the methods unambiguously.
Inspect the full range rather than only counting points outside the limits. A useful plot can reveal:
- a constant offset between methods;
- differences that grow or shrink with measurement magnitude;
- a fan-shaped spread indicating nonconstant variability;
- clusters associated with sites, subgroups, or testing conditions;
- outlying pairs requiring data verification or substantive explanation;
- floor or ceiling effects that restrict one method differently.
Do not automatically delete points outside the limits. Under a 95% model, some points are expected beyond them. Investigate recording, scoring, device, rater, and procedural causes. Report verified influential observations and show a justified sensitivity analysis when necessary.
Check the assumptions that matter
The conventional limits assume independent paired differences, approximately constant bias, approximately constant variance of differences, and a difference distribution for which mean and standard-deviation limits are sensible. Independence concerns participants or sampling units. It is violated when repeated pairs from the same person are analysed as unrelated observations.
Examine the distribution of differences
Inspect a histogram, quantile plot, and the Bland-Altman plot. Normality of the original method scores is not required; the conventional calculation concerns the differences. Strong skew, heavy tails, or distinct subgroups can make symmetric mean plus or minus 1.96 standard-deviation limits misleading.
A normality test should not be the sole decision rule. In a small sample it may miss important deviations, while in a large sample it may detect harmless ones. Use graphical evidence, design knowledge, and robustness checks. The psychology dissertation normality-testing guide explains this combined approach.
Look for proportional bias and heteroscedasticity
Proportional bias occurs when the expected difference changes with the measurement magnitude. Heteroscedasticity occurs when the spread of differences changes. A regression line of differences on an appropriate magnitude measure can help describe a trend, but the analysis should not reduce to one slope p-value.
If both the centre and spread change, constant horizontal limits are not appropriate across the entire range. Consider a justified transformation, percentage or ratio analysis for positive scales, or a regression-based agreement model. State the resulting estimand and interpret it on a scale that readers can understand.
Use logarithms or ratios carefully
When disagreement is proportional to magnitude and values are strictly positive, a logarithmic analysis may stabilise variability. Analyse the log difference, which corresponds to the log of a ratio. After back-transformation, report geometric mean ratios and multiplicative limits.
A ratio of 1 represents no systematic difference. Limits from 0.90 to 1.12 would mean that one method may produce values from about 10% lower to 12% higher than the other for most pairs, subject to the model and sampling uncertainty.
Do not log-transform scales containing zero or meaningful negative values without a valid model. A percentage-difference plot also becomes unstable when pair means approach zero. If the psychology score has arbitrary zero, bounded categories, or strong ceiling effects, seek a method appropriate to that scale rather than forcing a convenient transformation.
Handle repeated measurements correctly
The simple calculation assumes one independent pair per participant. Many psychology studies collect several trials, sessions, raters, or time points from each participant. Treating all pairs as independent underestimates uncertainty because observations within a person are correlated.
Averaging repeated observations can discard information about within-person repeatability and may not match the intended use. If routine practice will use the average of several readings, averaging can be relevant, but that decision must be defined in the estimand.
The 2026 BMC review of repeated-measurement method comparisons concludes that adjusted limits or modified mixed-effects limits are often more appropriate because they account for within-subject variability. The correct approach depends on whether replicates are paired, whether methods have equal numbers of readings, and whether repeatability differs between methods.
For repeated data, describe the variance components, correlation structure, and method used to obtain limits and confidence intervals. Do not label a standard one-pair calculation “adjusted” merely because a random intercept appeared elsewhere in the analysis.
Distinguish method comparison from test-retest reliability
Method comparison asks whether two procedures can be used interchangeably. Test-retest work asks how scores behave across occasions. A Bland-Altman plot can be informative in both settings, but the interpretation changes because genuine psychological change, memory, learning, fatigue, or regression to the mean may contribute to occasion differences.
If participants complete the same symptom scale two weeks apart, a mean shift may reflect population change rather than instrument bias. Define the stability assumption, justify the interval, and record intervening events. An agreement analysis cannot separate measurement error from real change without additional design information.
For two raters using a continuous scale, limits describe how far their ratings differ in the chosen order. If either rater is not exchangeable or the rating process is nested, a multilevel model may be needed. For categorical ratings, kappa-type or other category-specific agreement methods are more appropriate.
Plan psychology dissertation Bland-Altman analysis
A strong protocol identifies the population and covers the range in which the methods will be used. Restricting the sample to middle-range scores can hide disagreement at clinically or educationally important extremes. Recruitment should also represent relevant subgroups if agreement may vary by age, language, disability, device, site, or symptom severity.
Standardise measurement order, timing, instructions, calibration, environment, and blinding. Randomise method order when order effects are plausible. Record failed readings and exclusions for each method. If the reference procedure is noisy, include replicates that allow its repeatability to be estimated.
Preregister:
- the methods, units, and subtraction direction;
- the acceptable lower and upper differences;
- the population and measurement range;
- the number and structure of repeated readings;
- the conventional, transformed, or model-based analysis;
- diagnostic and sensitivity procedures;
- the confidence level and interval method;
- rules for missing, failed, or implausible measurements.
Worked psychology example
Imagine a dissertation comparing a new tablet-based attention task with a laboratory computer task. Both produce response-time scores in milliseconds. One pair is collected from each of 120 adults under standardised conditions. The student defines new minus laboratory as the difference and prespecifies acceptable limits of minus 50 to plus 50 milliseconds.
Suppose the mean difference is 8 milliseconds. This suggests that the tablet is slower on average, but the sign should be checked against the stated subtraction order. The standard deviation of differences is 30 milliseconds, producing estimated conventional limits near minus 51 and plus 67 milliseconds.
The average bias is small, yet the upper limit exceeds the acceptable positive boundary and the lower estimate is near the negative boundary. Confidence intervals around the limits extend further. The methods therefore cannot be declared interchangeable for individual scores under the prespecified criterion.
The plot also shows wider differences above 700 milliseconds. The student checks task logs and finds no miscoding. A sensitivity analysis models magnitude-dependent spread. The discussion states that disagreement may be more serious for slower responders and avoids presenting the correlation between task scores as evidence of agreement.
| Report section | Include | Avoid |
|---|---|---|
| Method | Design, pairing, order, units, acceptable limits, sample-size rationale | Calling the plot self-explanatory |
| Results | Bias, standard deviation, limits, confidence intervals, diagnostic plot | Reporting correlation alone |
| Sensitivity analysis | Influential pairs, transformed or repeated-measure model when justified | Deleting inconvenient observations silently |
| Discussion | Agreement relative to intended use and population | Claiming universal interchangeability |
Report the analysis transparently
Name the software, version, package or procedure, and confidence-interval method. State whether limits use 1.96 or a sample-based critical value and whether any small-sample correction was applied. Provide the exact sample included and reasons for exclusions.
Report descriptive statistics for both methods, the direction and mean of differences, standard deviation of differences, both limits, and confidence intervals for bias and limits. Describe the plot’s pattern, not only the number of points outside the lines.
State the prespecified acceptability criteria and compare them with estimates and uncertainty. The university record on Bland-Altman reporting standards highlights advance benchmarks, data structure, repeatability, diagnostic assessment, plotted and numerical bias, limits, and confidence intervals.
Share de-identified code and a data dictionary when ethically permitted. Never expose participant identifiers, raw free-text responses, or device files containing personal information.
Common mistakes to avoid
- Using correlation as proof that methods agree.
- Testing only whether mean bias differs from zero.
- Confusing estimated limits of agreement with acceptable-difference limits.
- Choosing acceptability bounds after viewing the plot.
- Omitting confidence intervals around the limits.
- Ignoring proportional bias or changing variance across the range.
- Treating repeated observations from one participant as independent.
- Applying logarithms or percentages to scales where they are not meaningful.
- Deleting points outside the limits automatically.
- Claiming interchangeability beyond the studied population and measurement range.
Frequently asked questions
What do the 95% limits of agreement mean?
Under the conventional assumptions, they estimate a range expected to contain about 95% of individual paired differences in the target population. They are estimates and should have confidence intervals.
Is a high correlation enough to show agreement?
No. Correlation measures association and can remain high despite a constant or proportional difference between methods. Agreement requires direct analysis of paired differences.
Must the original scores be normally distributed?
No. The conventional limits rely on the distribution of paired differences being suitable for mean and standard-deviation limits. Inspect those differences and the plot.
Can Bland-Altman analysis handle repeated measurements?
Yes, but the standard one-pair formula is usually inadequate. Use an adjusted or mixed-effects approach that reflects within-person correlation and the replicate structure.
What is proportional bias?
It means the expected difference changes with measurement magnitude. Inspect the difference plot and consider an appropriate regression, transformation, or magnitude-dependent agreement model.
How do I decide whether the limits are acceptable?
Define acceptable differences before analysis using psychological meaning, measurement consequences, prior evidence, or stakeholder requirements. The Bland-Altman calculation does not supply this judgement.
Can I use Bland-Altman analysis for Likert items?
Usually not for a single ordinal item because equal numerical spacing is not assured. A multi-item score may sometimes be treated as approximately continuous, but justify the scale and consider ordinal agreement methods.
Conclusion
Psychology dissertation Bland-Altman analysis makes agreement visible in the units that matter. Define acceptable disagreement, collect properly paired data, estimate bias and limits with confidence intervals, inspect magnitude-dependent patterns, and use an adjusted model for repeated observations.
If you need dissertation support, choose ethical tutoring that helps you understand and reproduce your own work. Retain responsibility for the design, code, plots, thresholds, and interpretation, protect participant information, and follow institutional requirements for permitted assistance.