Psychology Dissertation T-Test Guide: Choose and Report Your Test
This Psychology Dissertation T-Test Guide explains how to choose the correct test, check assumptions, interpret results, and report a mean comparison accurately. Use a one-sample test for comparison with a fixed reference, an independent-samples test for separate groups, and a paired-samples test for linked measurements.
Psychology Dissertation T-Test Guide: Which Test Fits?
A t-test evaluates a population mean or mean difference using sample data. It compares an estimated difference with its standard error: the estimated uncertainty arising from sampling variation. A visible difference between sample averages therefore does not automatically establish a population difference.
Table of Contents
One-Sample T-Test: Compare With a Fixed Reference
Choose this test when your research question compares one population mean with a specified benchmark. The video illustrates this using chocolate bars compared with their manufacturer’s claimed weight.
For psychology research, you might compare a sample’s mean task score with a theoretically justified reference. Explain why the benchmark is meaningful. If it is estimated from another sample, treating it as perfectly known ignores that estimate’s uncertainty; a two-sample comparison may be more appropriate.
Independent-Samples T-Test: Compare Separate Groups
Choose an independent test when different participants contribute observations to two groups. The illustration compares pain relief between people receiving different drugs.

A psychology dissertation might compare reaction times between two randomly assigned conditions. Participants should not appear in both groups, and observations should not contain unmodelled dependence. Independence concerns the research design, rather than whether the groups contain equal numbers of participants.
Paired-Samples T-Test: Compare Linked Measurements
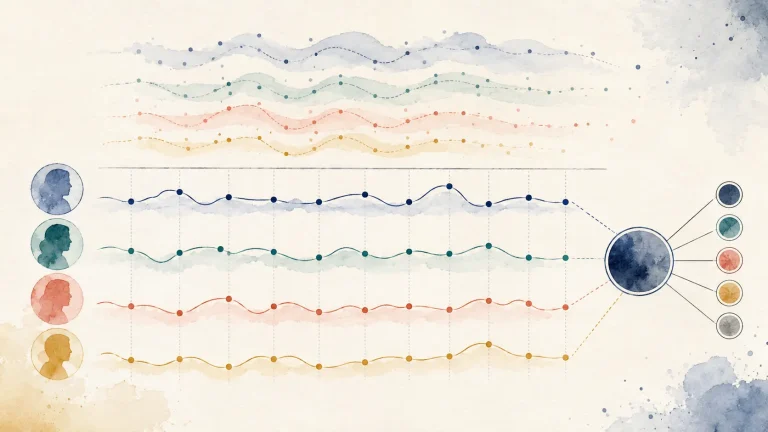
Choose a paired test when observations have a meaningful one-to-one relationship, such as the same participants measured before and after an activity. The guide uses weight measurements before and after a diet. Calculate one difference per pair. The paired test is then a one-sample test of whether the population mean difference equals zero. Matching two unrelated datasets merely because they have equal lengths does not create valid pairing.
State Your Hypotheses Before Analysing
For a two-sided one-sample test, the null hypothesis states that the population mean equals the reference value. For independent groups, it states that the population means are equal. For paired observations, it states that the population mean difference is zero. The corresponding alternatives specify a difference. These hypotheses concern population quantities, even though calculations use sample estimates. This distinction refines the transcript’s occasional wording about the sample mean.
One-Sided Versus Two-Sided Testing
A two-sided test considers differences in either direction. A one-sided test considers a specified direction, with its null also encompassing differences in the opposite direction. Justify a directional test before inspecting results. Do not switch to one-sided testing because a two-sided p-value misses your threshold. Record the planned comparison, direction, exclusions, and significance level in your psychology dissertation preregistration.
Check Assumptions and Data Quality
This transcript introduces measurement, normality, and equal variances. These checks require different interpretations depending on the test.
Measurement and Independence
Your outcome should support a meaningful numerical mean. A validated questionnaire total may be analysed as approximately continuous with justification; an unordered category cannot. Explain scoring, missing responses, and any transformations.
For paired tests, dependence within each pair is intentional, but different pairs should be independent. Students nested within classrooms or repeated observations beyond a simple pair may require multilevel modelling rather than an ordinary t-test.
Normality and Influential Observations
For exact small-sample inference, the one-sample model assumes normally distributed observations; independent tests assume normality within groups. Crucially, paired tests concern the distribution of the difference scores, not the separate before and after distributions.
Inspect plots and unusual observations rather than relying on a normality test alone. Larger samples can tolerate some departures, but no universal sample-size cutoff guarantees validity. These distinctions are explained in the creator’s updated t-test tutorial.
Investigate recording errors and influential values using a documented outlier-analysis process. Never remove genuine observations solely to obtain significance.
Equal Variances and Welch’s Test
The equal-variance assumption belongs to Student’s pooled independent-samples test. Welch’s independent-samples test does not require equal population variances and adjusts the standard error and degrees of freedom.
Why Levene’s Test Should Not Choose Automatically
The article suggests checking variances with Levene’s test. However, a nonsignificant variance test does not establish equality. Delacre, Lakens, and Leys recommend Welch’s test as a default for independent mean comparisons and explain problems with selecting tests conditionally on Levene’s result.
Welch’s method still requires appropriate measurement and independence; it does not repair every distributional problem. If severe skewness or influential observations threaten inference, consider methods appropriate to your estimand rather than automatically substituting a rank test.
Understand the Calculation and Decision
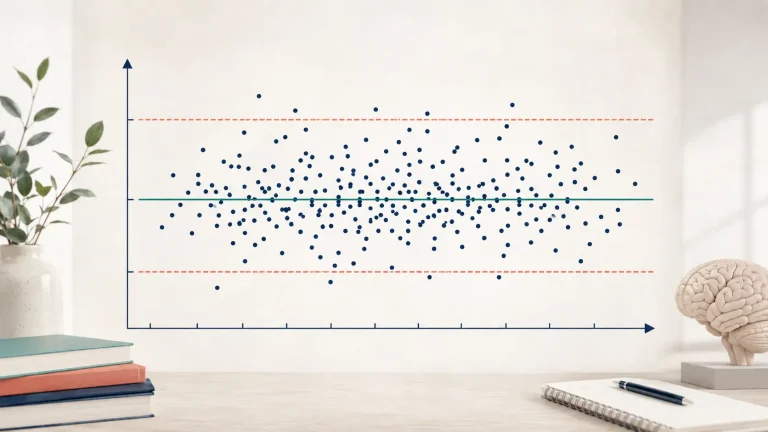
Across the three tests, the central calculation is an estimated difference divided by its estimated standard error. Holding uncertainty constant, a larger absolute difference produces a larger absolute t-statistic. Greater uncertainty reduces its magnitude.
For one sample, subtract the reference from the sample mean and divide by the sample standard deviation divided by the square root of sample size. For paired data, apply that calculation to the difference scores.
Independent tests combine uncertainty from both groups. NIST’s two-sample t-test guidance provides the pooled and unequal-variance formulas and the relevant rejection regions.
Degrees of Freedom and Critical Values
Degrees of freedom determine which t-distribution is used. One-sample and paired tests use n minus one, where n counts observations or complete pairs. The pooled independent test uses the combined group sizes minus two; Welch’s degrees of freedom may be fractional.
The guide follows a demo of a two-sided test with nine degrees of freedom: the critical magnitude is approximately 2.262 at alpha .05. A t-statistic of 2.5 gives p approximately .034. Compare absolute t with the two-sided critical value, so sufficiently negative statistics also count.
Interpret P-Values Without Overclaiming
A p-value is the probability, under the null hypothesis and statistical assumptions, of a test statistic at least as extreme as observed. It is not the probability that the null hypothesis is true or that chance caused your finding. Choose alpha beforehand. Under the model, it controls the long-run probability of rejecting a true null hypothesis. The American Statistical Association warns that p-values do not measure effect importance. A nonsignificant result means failure to reject the null; it does not demonstrate equality.
Worked Psychology Example and Reporting
Consider an illustrative study of ten students’ anxiety scores before and after a workshop. These invented summary values demonstrate the method; they are not evidence from the video or an actual intervention.
Define each difference as before minus after. Suppose the mean difference is 4 points and its standard deviation is 5.06. The standard error is approximately 1.60, giving t approximately 2.50 with nine degrees of freedom and a two-sided p-value approximately .034.
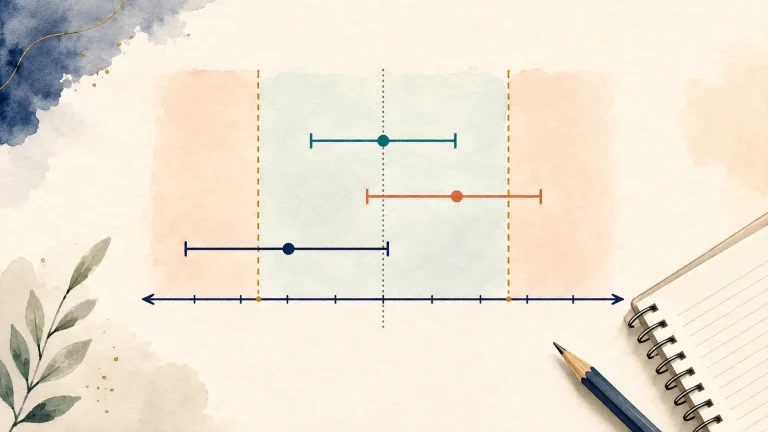
The corresponding 95% confidence interval is approximately [0.38, 7.62] points. The paired standardised effect, Cohen’s dz, is approximately 0.79, calculated using the standard deviation of differences. Specify the effect-size convention because different paired standardisations answer different questions.
A suitable report is: “Anxiety scores decreased by an average of 4.00 points, 95% CI [0.38, 7.62], t(9) = 2.50, p = .034, dz = 0.79.” Also report each occasion’s mean, standard deviation, complete-pair count, and missing-data handling from the actual dataset.
This uncontrolled comparison establishes a change in the observed sample, not that the workshop caused it. Discuss alternative explanations and uncertainty. Use the effect-size guide to connect numerical magnitude with psychological relevance.
Keep Software Output and Research Claims Separate
Before accepting an automated interpretation, confirm the group coding, subtraction order, selected test, and whether the displayed p-value is one-sided or two-sided. A negative t-statistic can simply reflect the order of subtraction; it does not inherently indicate a poor outcome.
Keep the raw dataset unchanged and save an analysis copy. Document how incomplete pairs were handled, because excluding participants can affect both precision and the population represented. If you conduct an additional analysis after seeing results, label it exploratory and explain its purpose. These records make your dissertation easier to audit and help your supervisor understand exactly how you reached each conclusion, including decisions that software cannot justify for you.
A Conclusive Practical Dissertation Workflow
First, define your question, outcome, and comparison. Second, select the test from the design. Third, plan sample size using a justified target effect, alpha, and power: the probability of rejecting the null under a specified alternative. R’s power documentation describes these inputs.
Fourth, check data structure, assumptions, missingness, and exclusions. Fifth, run the planned analysis and retain reproducible syntax and as an online calculator; our SPSS dissertation guide supports a documented software workflow.
Finally, report estimates, uncertainty, effect size, and limitations. Plan multiple-comparison handling when testing several outcomes. For questions involving several groups or factors, consult the ANOVA guide instead of running unplanned t-tests.
Enquire about psychology dissertation statistics tutoring for help choosing, interpreting, and reporting your analysis confidently while completing your own research.